
-
Welcome to Smogon! Take a moment to read the Introduction to Smogon for a run-down on everything Smogon, and make sure you take some time to read the global rules.
-
Congrats to the winners of the 2023 Smog Awards!
Tournament World Cup of Randbats 2023 - Qualifying Round
- Thread starter sharpclaw
- Start date
- Status
- Not open for further replies.
won 2-1 vs xceloh
https://replay.pokemonshowdown.com/gen6randombattle-1924928681-81iuityt6n1yyetxjyzysfjlem7t4zjpw
https://replay.pokemonshowdown.com/gen6randombattle-1924928681-81iuityt6n1yyetxjyzysfjlem7t4zjpw
https://replay.pokemonshowdown.com/gen6randombattle-1924944729-1jm3m6i2tscpqxbwgvazghfkxtq2ixlpw
https://replay.pokemonshowdown.com/gen6randombattle-1924928681-81iuityt6n1yyetxjyzysfjlem7t4zjpw
https://replay.pokemonshowdown.com/gen6randombattle-1924928681-81iuityt6n1yyetxjyzysfjlem7t4zjpw
https://replay.pokemonshowdown.com/gen6randombattle-1924944729-1jm3m6i2tscpqxbwgvazghfkxtq2ixlpw


won vs accidere ggs
https://replay.pokemonshowdown.com/gen9randombattle-1924981169
https://replay.pokemonshowdown.com/gen9randombattle-1924988976-5vb9hllg7jzp572lcuadi8v2cqg5e6hpw
https://replay.pokemonshowdown.com/gen9randombattle-1924992924-uxstlv3ul9qya8a5airzscleee4wxtgpw
https://replay.pokemonshowdown.com/gen9randombattle-1924995685


Won in 3 vs Raahel, gg's.
https://replay.pokemonshowdown.com/gen2randombattle-1925371747-ssiwsaxwjjuv3rmiw8h9dxibhe7kqllpw
https://replay.pokemonshowdown.com/gen2randombattle-1925378770-3i5m4xwf9ranagvy6kbcdkde2xh5zkupw
https://replay.pokemonshowdown.com/gen2randombattle-1925386365-uayfnhir7gmo3l42mvb5ukp6jitp7qspw
https://replay.pokemonshowdown.com/gen2randombattle-1925371747-ssiwsaxwjjuv3rmiw8h9dxibhe7kqllpw
https://replay.pokemonshowdown.com/gen2randombattle-1925378770-3i5m4xwf9ranagvy6kbcdkde2xh5zkupw
https://replay.pokemonshowdown.com/gen2randombattle-1925386365-uayfnhir7gmo3l42mvb5ukp6jitp7qspw
Ice Yazu
I COULD BE BANNED!
Peum
formerly Mandibuladel5555
Won in 2 vs StormPegasus, ggs
https://replay.pokemonshowdown.com/gen1randombattle-1925589618
https://replay.pokemonshowdown.com/gen1randombattle-1925598557
https://replay.pokemonshowdown.com/gen1randombattle-1925589618
https://replay.pokemonshowdown.com/gen1randombattle-1925598557
Won vs Lupus fluvium , GGs
https://replay.pokemonshowdown.com/gen6randombattle-1925587650-u63zxe9hlyjr733xy0uqdu7eewx3s6jpw
https://replay.pokemonshowdown.com/gen6randombattle-1925593203-goard0pk8sg16zbmx9ggz1zwocp6rudpw
https://replay.pokemonshowdown.com/gen6randombattle-1925597818-it44opkpf763g7qhu7akg9z9jbi3oowpw
https://replay.pokemonshowdown.com/gen6randombattle-1925587650-u63zxe9hlyjr733xy0uqdu7eewx3s6jpw
https://replay.pokemonshowdown.com/gen6randombattle-1925593203-goard0pk8sg16zbmx9ggz1zwocp6rudpw
https://replay.pokemonshowdown.com/gen6randombattle-1925597818-it44opkpf763g7qhu7akg9z9jbi3oowpw
The fight for qualifying spot Rise Up Bangladesh Supporters
Rise Up Bangladesh SupportersNow that all my games are done, I can focus on what really matters: the stats
I've been gathering my own independant stats for the qualifiers, while also running some simple predictive models to estimate how it would conclude
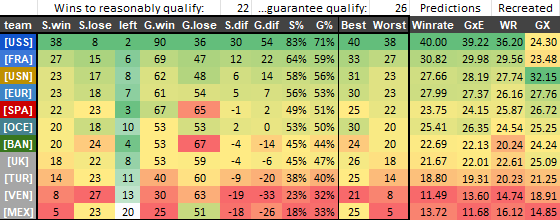
First and foremost, I'd like to congratulate teams US South and France for already having their place in the tournament guaranteed - USS had achieved this in the first week, but France just managed to get over the line while I was asleep. Even if they lost all their remaining rounds, and every other team won all theirs (an impossibility of course, but regardless) USS would end the qualifiers in 1st place (!) while France would end in 5th. A great showing from both of you!
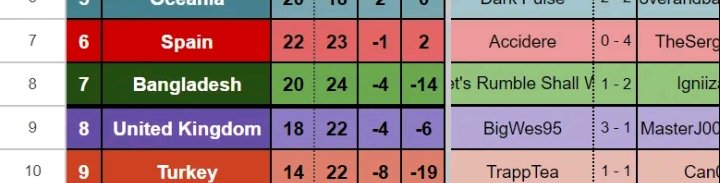
Next, while most teams are nearing the end of their games, The tournament is far from over. Bangladesh are having a surprisingly good run, and are currently in a the running to knock UK out of the qualifiers! There are still more games to go, however, and anything could happen.
Finally, I'll explain the 4 columns on the right. These are my simple predictive models. They use the same formula, however are seeded with different numbers.
"Winrate" is seeded by the Game winrate of each player, and cross-checks that with the winrate of each opponent that has not yet been played. Fractional points are then awarded based on the probability of victory. For example, Peap and Trade have not yet played against each other. Peap has a winrate of 71.4% so far in this tournament, while trade's winrate is 50% on the nose. Without explaining the math, this means that the prediction would award 0.714 points to peap, and 0.287 points to trade.
"GxE" instead uses, well, the GxE of players. Unfortunately a bunch of people here don't play ladder, so this data ended up being quite innacurate. For the main event I might try and scrape previous tournament results to get further data on players.
The last 2 columns are repeats of the first 2, however they do not take into account completed games, and pretend we restarted this tournament from the first game. This helps highlight the inconsistancies of using GxE as a measurement.
We may be nearing the end of the qualifiers, but there's still plenty more games to play, and so plenty of more chances for these numbers to change. I can't wait to see where everything lines up, and how accurate my models end up looking
(ps, I first started making this because I didn't realise that the official spreadsheet had a "team standings" tab, so... stupidity is the mother of invention?)
I've been gathering my own independant stats for the qualifiers, while also running some simple predictive models to estimate how it would conclude
First and foremost, I'd like to congratulate teams US South and France for already having their place in the tournament guaranteed - USS had achieved this in the first week, but France just managed to get over the line while I was asleep. Even if they lost all their remaining rounds, and every other team won all theirs (an impossibility of course, but regardless) USS would end the qualifiers in 1st place (!) while France would end in 5th. A great showing from both of you!
Next, while most teams are nearing the end of their games, The tournament is far from over. Bangladesh are having a surprisingly good run, and are currently in a the running to knock UK out of the qualifiers! There are still more games to go, however, and anything could happen.
Finally, I'll explain the 4 columns on the right. These are my simple predictive models. They use the same formula, however are seeded with different numbers.
"Winrate" is seeded by the Game winrate of each player, and cross-checks that with the winrate of each opponent that has not yet been played. Fractional points are then awarded based on the probability of victory. For example, Peap and Trade have not yet played against each other. Peap has a winrate of 71.4% so far in this tournament, while trade's winrate is 50% on the nose. Without explaining the math, this means that the prediction would award 0.714 points to peap, and 0.287 points to trade.
"GxE" instead uses, well, the GxE of players. Unfortunately a bunch of people here don't play ladder, so this data ended up being quite innacurate. For the main event I might try and scrape previous tournament results to get further data on players.
The last 2 columns are repeats of the first 2, however they do not take into account completed games, and pretend we restarted this tournament from the first game. This helps highlight the inconsistancies of using GxE as a measurement.
We may be nearing the end of the qualifiers, but there's still plenty more games to play, and so plenty of more chances for these numbers to change. I can't wait to see where everything lines up, and how accurate my models end up looking
(ps, I first started making this because I didn't realise that the official spreadsheet had a "team standings" tab, so... stupidity is the mother of invention?)
won vs disgusting, ggs
https://replay.pokemonshowdown.com/gen4randombattle-1925713948-omc9vkyxvyizc9i83o03gd6jw5bs2efpw
https://replay.pokemonshowdown.com/gen4randombattle-1925717275-ga1k37qna7sw4xg9tgaaz8or5qb2675pw
https://replay.pokemonshowdown.com/gen4randombattle-1925721976-f74tnsrhsrdmq85j2bpwuqg742otkd5pw
https://replay.pokemonshowdown.com/gen4randombattle-1925713948-omc9vkyxvyizc9i83o03gd6jw5bs2efpw
https://replay.pokemonshowdown.com/gen4randombattle-1925717275-ga1k37qna7sw4xg9tgaaz8or5qb2675pw
https://replay.pokemonshowdown.com/gen4randombattle-1925721976-f74tnsrhsrdmq85j2bpwuqg742otkd5pw


All of this is very cool, great job!
Feel free to grab the info of all RBTT's from the link on my signature (also available on our website HoF)For the main event I might try and scrape previous tournament results to get further data on players.
Calling activity vs Angel tiopo
It's 35 mins after our scheduled time (30 mins after Drifting contacted Team Mexico) and he or a sub has not shown up.
Furthermore, he hasn't been online since Tuesday Australian time, so yeah.
I don't like calling activity, but I don't like people not respecting my time enough to tell me they can't make it, so...
Cc: sharpclaw
Last edited:

Won vs kaipro sry for rby momento
https://replay.pokemonshowdown.com/smogtours-gen1randombattle-710640
https://replay.pokemonshowdown.com/smogtours-gen1randombattle-710642
https://replay.pokemonshowdown.com/smogtours-gen1randombattle-710640
https://replay.pokemonshowdown.com/smogtours-gen1randombattle-710642

how are these calculated? 0.714 seems like 71.4/100 but 0.287 seems to come out of nowhere other than possibly being 1 - 0.714 with a rounding error. is this something similar to strength of schedule / what are its advantages over strength of schedule?"Winrate" is seeded by the Game winrate of each player, and cross-checks that with the winrate of each opponent that has not yet been played. Fractional points are then awarded based on the probability of victory. For example, Peap and Trade have not yet played against each other. Peap has a winrate of 71.4% so far in this tournament, while trade's winrate is 50% on the nose. Without explaining the math, this means that the prediction would award 0.714 points to peap, and 0.287 points to trade.
if "WR" doesn't take into account completed games and restarts from 0, what are the above fractional points that are then used to calculate "WR" derived from?The last 2 columns are repeats of the first 2, however they do not take into account completed games, and pretend we restarted this tournament from the first game.
i agree that it'd be difficult to find gxe's of players, but how did you end up with sub 40 gxe's for any team? it takes a concerted effort of forfeiting every game to hit below 50, let alone the 11 mexico has in your stats"GxE" instead uses, well, the GxE of players. Unfortunately a bunch of people here don't play ladder, so this data ended up being quite innacurate.
- Status
- Not open for further replies.