
This is a simple program I made that creates a graph of Pokemon usage over time. It looks at the most recent stats to see the most used Pokemon (you tell it how many to look at) and it plots those Pokemon's usage over time. It's kind of interesting to look at.
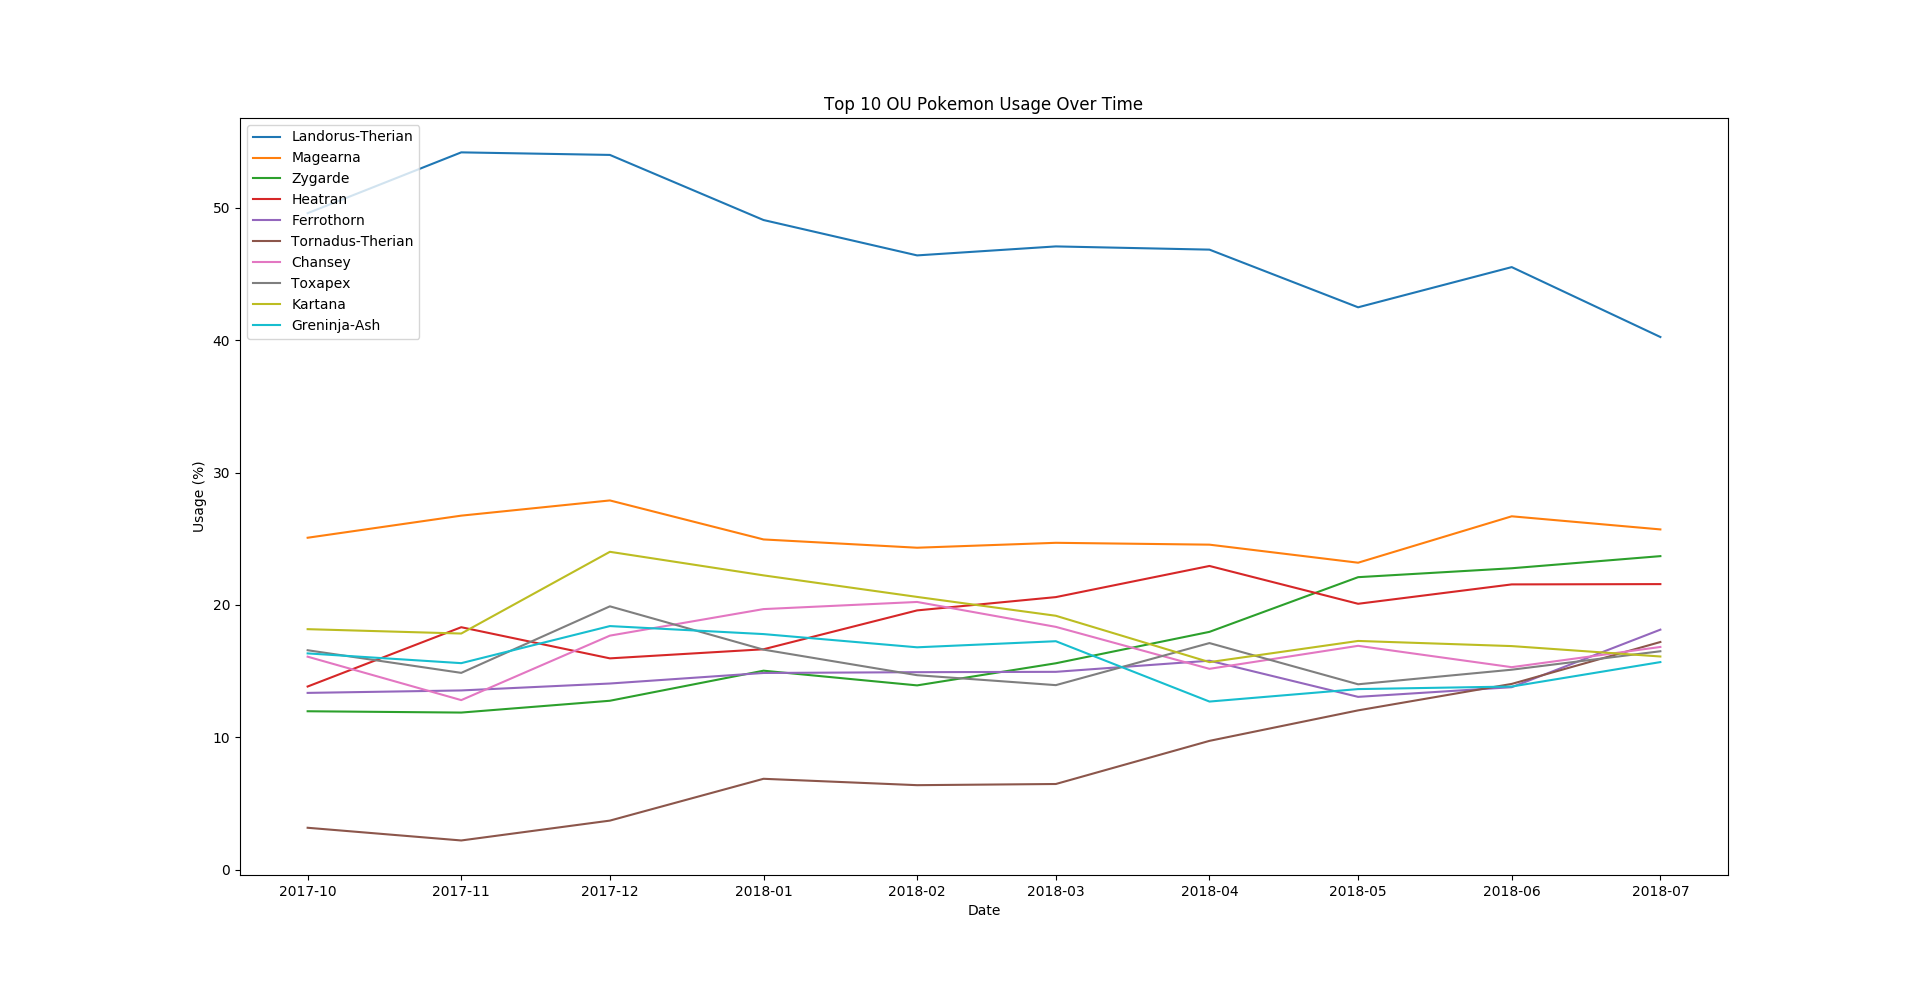
Here's the result for OU:
I've already generated the graphs for all the major tiers here
edit: vector image edition of the stats (try viewing them in a new tab)
Here's a zip file that contains an exe that runs the program as well as its Python 2.7 source code.
Here's the result for OU:
I've already generated the graphs for all the major tiers here
edit: vector image edition of the stats (try viewing them in a new tab)
Here's a zip file that contains an exe that runs the program as well as its Python 2.7 source code.
Last edited:
